Understanding and Integrating Resolution, Accuracy and Sampling Rates of Temperature Data Loggers Used in Biological and Ecological Studies-Juniper Publishers
Juniper Publishers-Open Access Journals in Engineering
Technology
Abstract
During the 5th Workshop about Temperature-Dependent Sex Determination held in the 38th
International Sea Turtles Symposium (16-22
February 2018) in Kobe, Japan, we discussed the uncertainty of
temperatures recorded by data logger and their calibration. We report
here
an extension of this discussion. First, we propose a way to estimate the
uncertainty of the average temperature recorded using data loggers
considering the accuracy of the data logger (repeatability of
measurements), resolution of the data logger (resolution of its
indicating device) and
period of sampling temperature. Second, a general procedure of
calibration is described. Functions to perform the estimates are
provided in R
package embryo growth freely available.
Keywords: Data logger; Temperature; Resolution; Accuracy; Uncertainty; Sampling period; Calibration
Introduction
Metabolism is the process by which energy and materials
are transformed within an organism and exchanged between
the organism and its environment [1]. The metabolic rate is the
rate at which organisms transform energy and materials and is
governed largely by two interacting processes. The first is the
Boltzmann factor, which describes the temperature dependence
of biochemical processes, and the second is the quarter-power
allometric relation, which describes how rates of biological
processes scale with body size [2]. Hence, temperature is a key
factor in understanding the persistence of organisms within an
ecosystem. The range of temperatures within which an organism
can survive is termed its thermal niche [2]. For many vertebrates,
the thermal niche is relatively wide and centered around 30°C
[3]. Thus, when temperature is recorded in the purpose of
defining a thermal niche, the accuracy of measurements will not
have a major impact on the outcomes of this kind of study.
However, for some physiological processes, thermosensitive
changes can occur within a small range of temperatures, and
thus the accuracy and resolution of temperature recording
instruments become much more important. For example, in
turtles egg, incubation temperature during embryogenesis
affects various aspects of development [4], including probability
of embryo survival [5], sex determination for species with
temperature-dependent sex determination [6], and morphology
and body size at hatching [7]. In addition, incubation temperature
can have long-term effects on the physiology and behavior of
hatchlings [8]. Many researchers use data loggers inside the
nest cavity to generate temperature records during incubation,
to later compare them with various characteristics of hatchlings
(e.g., size, performance, sex). However, the uncertainty of data
logger measurements can affect the conclusions in some cases.
For example, the sex ratio for the leatherback marine turtle shifts
from 100% males to 100% females in less than 0.6°C at constant
temperatures [9], which can be on the same magnitude as the
uncertainty of temperature measurement for many experiments.
Indeed, 10 out of 141 published studies on reptile egg incubation
reported datalogger accuracy as 0.6 C or higher [10]. However, it
is important to note that the term “accuracy” is not well defined
in most of these publications.
Thus, as a first step, it is important to recall some
important
concepts used in metrology [11]. The word “uncertainty”
means doubt, and thus in its broadest sense “uncertainty of
measurement” means doubt about the validity of the result of a
measurement. The uncertainty of measurement is a parameter,
associated with the result of a measurement, that characterizes
the dispersion of the values that could reasonably be attributed to the
measurand. The measurand is a particular quantity subject
to measurement. Uncertainty of measurement comprises, in
general, many components. Some of these components may
be evaluated from the statistical distribution of a series of
measurements and can be characterized by experimental
standard deviations. The other components, which also can
be characterized by standard deviations, are evaluated from
assumed probability distributions based on experience or other
information.
The accuracy of measurement is the closeness of the
agreement between the result of a measurement and a true
value of the measurand. It is stressed that the term “precision”
should not be used for “accuracy” and that the true value of the
measurand is never known.
Repeatability of results of measurements is the closeness of
the agreement between the results of successive measurements
of the same measurand carried out under the same conditions
of measurement. Repeatability may be expressed quantitatively
in terms of the dispersion characteristics of the results using
multiple of standard deviation or width of confidence interval.
One source of uncertainty of a digital instrument is the
resolution of its indicating device. For example, even if the
repeated indications were all identical, the uncertainty of the
measurement attributable to repeatability would not be zero,
for there is a range of input signals to the instrument spanning
a known interval that would give the same indication. If the
resolution of the indicating device is the value of the stimulus
that produces a given indication X can lie with equal probability
anywhere in the interval X − δx/2 to X + δx/2.
The stimulus is thus described by a rectangular probability
distribution of width δx with variance u2 = (δx)2/12, implying
a standard uncertainty of u = 0.29 δx for any indication.
Repeatability and resolution of indicating device are uncertainty
components linked to the dataloggers characteristics. Uncertainty
can arise also from the experimental procedure used to obtain
measurements. The experimenter can choose different time
frequency of reading measurements. The objective of this work
is to characterize and propose a standardized method to present
uncertainties while working with temperatures recorded during
embryo studies.
There are different brands of data loggers available in the
market, all of them with different features. Two characteristics
which will affect uncertainty of measurement are particularly
important when choosing a particular model: accuracy
(precision of the material to record temperature) and resolution
(how many digits are recorded). In addition, the researcher must
define the rate of temperature data recordings during the period
when the data logger will be used. In some cases, data loggers
may have high resolution but low accuracy, or limited flexibility
in the rate of data collection. Ordering a set of data loggers can
be a Cornelian dilemma: should the priority be optimization of
accuracy, of resolution, or the sampling rate?
An important first step is to clearly conceptualize the
difference between resolution and accuracy. Resolution refers
to the level of specificity that the data logger will record
temperature in its memory. For example, a resolution of 0.5°C
indicates that temperatures will be recorded by bins of 0.5°C,
even if the electronic chips can read internally the temperature
with better resolution. The number of possible temperature
records that can be stored during a session is positively related
to the available memory but negatively related to the resolution
and the range of temperatures that can be recorded. Some data
loggers allow the user to choose between several options to
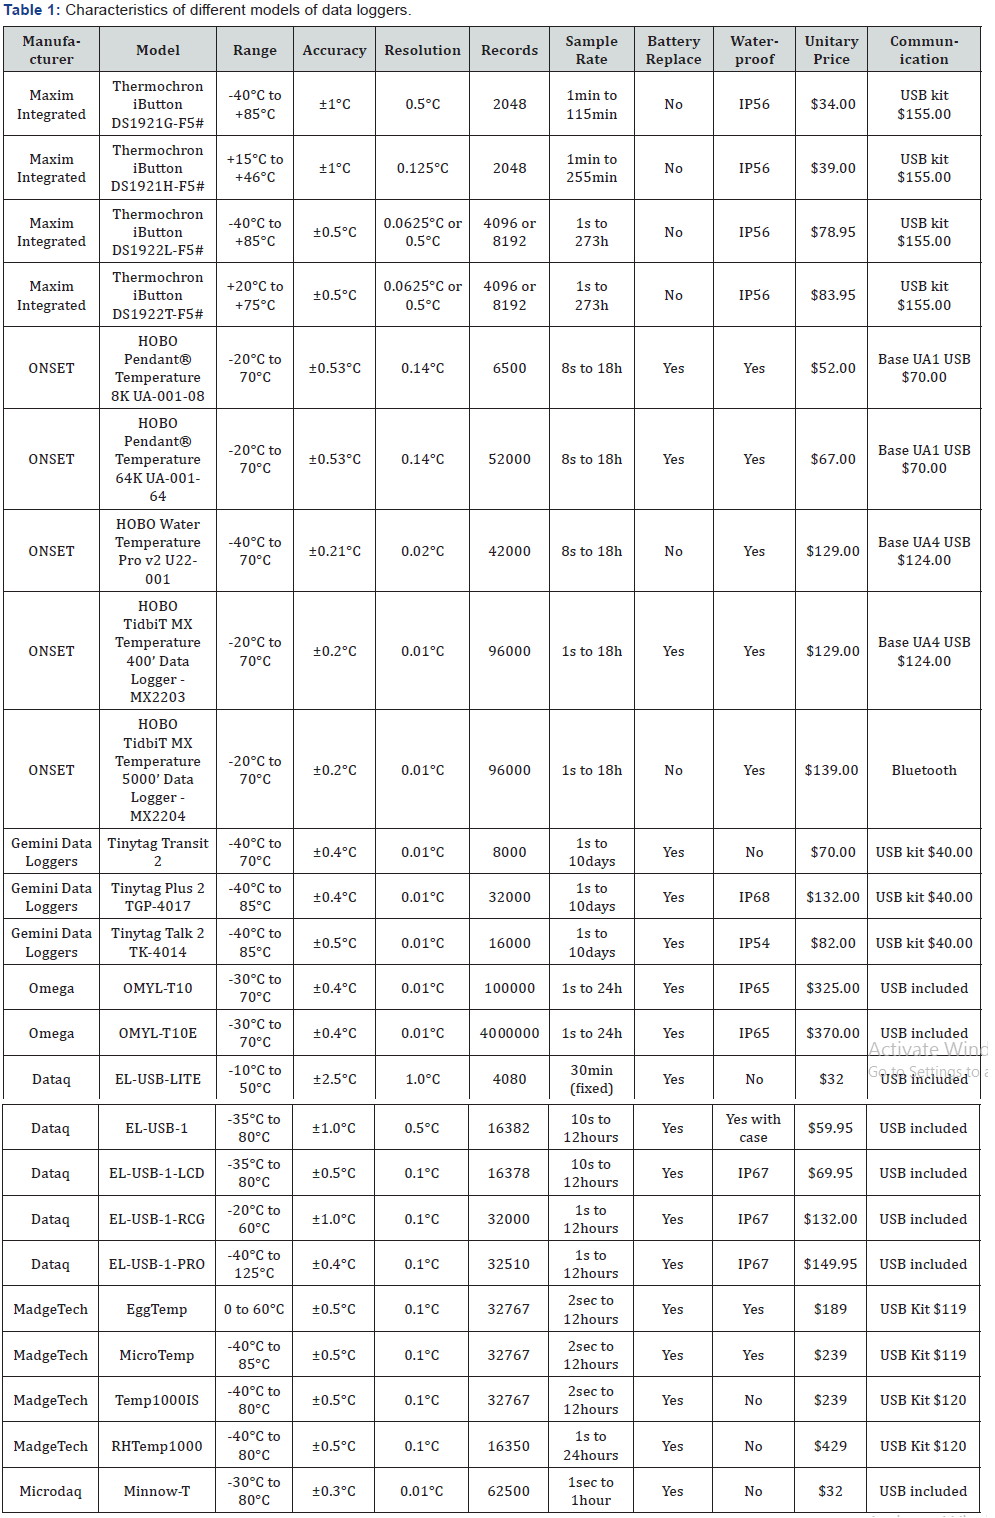
optimize eithe the resolution or the memory (Table 1).
For commercially available temperature data loggers,
accuracy is represented in the particular logger’s technical
datasheet as a range (±x°C), with x representing how close an
individual recorded data point is from the true value. From a
statistical point of view, this statement is too imprecise to be
useful, because it is not clear if the ±x indicates a confidence
interval, and if it is, there is no information about the underlying
distribution and the range. Furthermore, it is not known if the
data are censored or truncated [12]. In order to investigate this,
we contacted the technical staff of the reseller PROSENSOR
(Amanvillers, France) and they defined accuracy as the
“maximal uncertainty of the measure”. However, this does not
provide detail concerning the statistical distribution under
consideration. We also contacted the technical support group at
Onset Computer (Massachusetts, USA) about their definition of
accuracy, to which the leader of the support group stated “I can
say that the probability of the logger being within the advertised
accuracy is very high. NIST testing can confirm that.” (NIST is
the U.S. Commerce Department’s National Institute of Standards
and Technology, which provides calibration services for
temperature recording equipment). The statement from Onset
Computer confirmed that a statistical distribution underlies
what temperature data logger reports but again provided no
specifics about the exact distribution. We assume that in both
cases, the distributions of values generated by the data loggers
were either a Gaussian or a uniform distribution. For modelling
purposes, we assume the values generated conform to a uniform
rectangular distribution, because it is a more conservative
estimate (every allowable value is equally likely) and we cannot
rule out data truncation by the data loggers due to limitations of
their resolution. For this uniform distribution, the minimum and
maximum possible values are defined by the ±x accuracy.
The uncertainty is then a specific measure of the quality of
temperature recording by data loggers, considering the accuracy,
the resolution and the sampling rate. Data logger uncertainty
is then defined by the 95% confidence interval of the average
temperature during a certain time, recorded during set sampling
period by a data logger with known accuracy and resolution
(Table 1).
Furthermore, we propose a standardized method to
calibrate data loggers. The experimental procedure used for data logger calibration is sometimes described with detail
in publications [13,14] but often the published procedure is
reported as a simple comparison with a mercury thermometer.
Furthermore, even when the experimental procedure was clearly
stated, the mathematical method used to correct data logger
temperatures when more than 2 control temperatures are used
is rarely indicated. Regular calibration testing of data loggers is
important because the drift of temperature accuracy can be as
large as 0.1°C/year (for UA-001-08, pers. comm. from technical
support group at Onset Computer). Our standardized method of
calibration uses both a precise experimental procedure and a
precise mathematical procedure.
Materials and Methods
Uncertainty of a Measurement
We generated a simulation to measure the impacts of
the accuracy, the resolution and the sampling rate on the
quality of the average temperature data that are reported in
published studies. To do this, we generated 10,000 time series
of temperatures gradually changing at a rate chosen in a uniform
distribution from -0.002 to +0.002°C per minute with the initial
temperature being chosen in a uniform distribution from 25 to
30°C. We then retained only those records of the time series that
corresponded to a specified sampling rate (e.g., for a sampling
rate of 60 minutes, we retained only temperature data that
occurred at the completion of every 60 minutes time bin). To
incorporate errors associated with data logger accuracy, we
added to each retained temperature a random number obtained
from a uniform distribution centered on 0 and with minimum
and maximum corresponding to the reported accuracy of each
data logger. We truncated the recorded temperatures to mimic
the impact of the limitations of the resolution of each data logger
(the resolution effect). From a mathematical point of view, the
resolution effect can be obtained using this formula:
int ((temperature + resolution / 2)*(1/ resolution))*resolution
With int being the closest allowable value based on the
assumed level of resolution. This formula ensures that the
truncation effect is well centered in the interval. As an example,
assume a dataset has the following temperatures: 30, 30.1, 30.2,
30.3, 30.4, and 30.5°C, with assumed data logger resolution
being 0.5°C. Applying this formula, the dataset is converted to
what the data logger should report according to its resolution:
30.0, 30.0, 30.0, 30.5, 30.5, and 30.5°C.
Next, the uncertainty is defined as the 95% confidence
interval of the difference between the true mean value and
the recorded mean value during the relevant interval of time
calculated for all the replicates. For the purpose of this test, we
have created a function in the R package embryo growth
(version 7.3 and higher) available in CRAN:
uncertainty.datalogger (sample. rate,
accuracy, resolution,
max.time = 10 * 24 * 60,
replicates = 1000)
With sample.rate being the sample rate in minutes, accuracy
being the accuracy of the data logger in °C, resolution being the
resolution of the data logger in °C, and max.time being the total
time period in minutes over which an average temperature is
estimated. This function will generate replicates values of the
average temperature for the whole period, and the uncertainty is
defined by the range of 95% confidence interval of the difference
between true and estimated mean temperature. Optional
parameter method is used to control the output estimate as
described in the help page of the function that can be displayed
using ?uncertainty.datalogger.
Calibration of Data Loggers
For calibration purpose, the data loggers must be checked
against at least 3 known temperatures, but better with more,
and the recorded temperatures from the data loggers must
be compared against temperatures concurrently read from
a certified thermometer. A certified thermometer is one that
has been certified as being accurate by a national standards
laboratory, such as NIST in the U.S. Note that even certified
thermometer should be checked for validity periodically, by
sending them for testing to a national standards laboratory.
For the comparison at the known temperatures, the data
loggers being tested should be immersed in a water bath (be
sure the data loggers are waterproof) at the same time as the
certified thermometer, preferably with water being stirred the
entire time. The data logger should be programmed to record
temperatures every minute, with the time of data recording
noted by the researcher. At each minute the data logger records
a temperature value, the researcher should also record the
temperature from the certified thermometer. Begin with the
water heated to the maximum anticipated temperature the data
loggers will be recording during future research studies, and
lastly the minimum anticipated temperature. It may be necessary
to add colder water to the stirred bath if the lower end of the
anticipated temperature range is below room temperature. The
temperatures recorded with the certified mercury thermometer
will serve as a reference to correct the temperatures recorded
with the data logger. To make this calibration simpler, we have
created a function: calibrate.datalogger () in the embryo growth
R package
(version 7.3 and higher):
calibrate.datalogger (control.temperatures,
read.temperatures,
temperature.series, se. fit)
Where control.temperatures are the calibration temperatures,
read.temperatures are the temperatures returned for
each of the control.temperatures, temperature.series is a series
of temperatures to be corrected using the calibration, and se.fit
indicates whether standard error of the corrected temperatures
should be returned. A generalized additive model (parameter
gam = TRUE) or a general linear model (parameter gam = FALSE)
with Gaussian distribution of error and an identity link is used
for this purpose. The help page of the function that can be displayed
using?calibrate.datalogger.
Results
Uncertainty of a Measurement
The uncertainty of measures obtained with two different
data logger models were estimated using uncertainty.datalogger
() function with 10,000 replicates and average for 10 days.

*The IP is an international standard published by the
International Electrotechnical Commission (IEC). It uses a 2-number
code, the first one
designates dust resistance (0 to 6) and the second one designates water
resistance (0 to 8); the higher the number, the more resistant is the
product.
The results for iButton DS1921G-F5# (table 1) were
generated using:
uncertainty.datalogger (sample.rate=c(30, 60, 90, 120),
max.time = 10 * 24 * 60,
accuracy=1, resolution=0.5)
The results were (Table 2):
and for Tinytag Talk 2 TK-4014 (Table 2), the results were
generated with:

uncertainty.datalogger (sample.rate=c (30, 60, 90, 120),
max.time = 10 * 24 * 60,
accuracy=0.5, resolution=0.05)
The results were (Table 3):

The uncertainty returned by this function corresponds to
the 95% confidence interval width of the difference between
true average temperature and recorded average temperature:
the uncertainty of the Tinytag Talk 2 TK-4014 for the average
temperature recorded every 60 minutes is around 0.07°C
whereas it is only around 0.15°C for the iButton DS1921G-F5#.
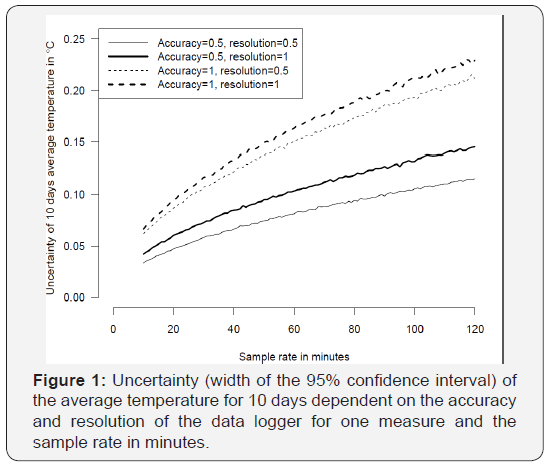
It should be noted that the response was not linear and
uncertainty increased as the time interval between samples
increased (Figure 1). The uncertainty is more dependent on
the accuracy and second on the resolution. The measures were
obtained with a large range of temperatures and temperature
variations, thus the estimated uncertainty can be considered as
being dependent only on the data logger characteristics and the
sampling rate of temperatures.

Calibration of Data Loggers
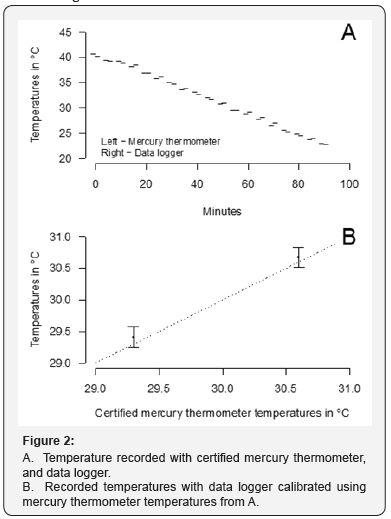
Water was heated to 40°C in a microwave oven and a UA-
001-08 data logger was immersed in the water as well as a
certified mercury thermometer. Temperatures were recorded
with the data logger and read in thermometer every 5 minutes
until water temperature reached air temperature +5°C (Figure
2A). Then the calibration procedure has been run using the
function calibrate.datalogger () in R package embryo growth.
The corrected temperature recorded by data logger and the temperature recorded using certified mercury thermometer are
shown in Figure 2B.

Discussion
The choice of a sampling rate should depend on the required
level of uncertainty for the average temperature considered, on
the available memory in the data logger, and the availability and
cost of different data loggers. It is particularly useful to define
precisely the uncertainty of the measured temperature when
the studied phenomenon is highly sensitive to temperature
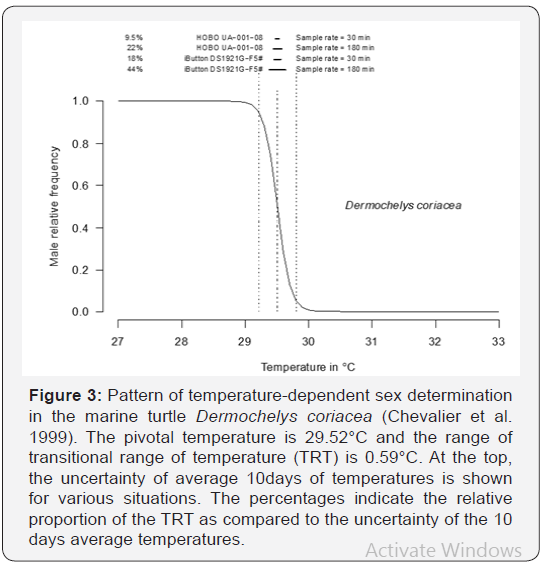
change. For example, the pattern of temperature-dependent
sex ratio in the marine turtle Dermochelys coriacea shifts
from 100% males to 100% females in less than 0.6°C [9,15].
This range of temperatures producing both sexes is called the
transitional range of temperatures (TRT). In this case, when the
average temperature is studied for 10 days, which correspond
to the thermosensitive period of the development (TSP) at high
incubation temperatures [16], the ratio between uncertainty of
average temperature and TRT can be as high as 24% (Figure 3).
In such a case it will be difficult to estimate the real impact of
temperature change for this characteristic.
Calibration does not seem to be a critical part of the procedure
with our tested data logger: the uncertainty of data logger was
on the same order than the uncertainty of certified mercury
thermometer and much better than the uncertainty of certified
alcohol thermometer. However, we recommend to always
calibrate data logger before and after use for an experiment
especially for long period of recording. Both before and after
calibrated time series must be included in control. temperatures
and read. temperatures parameters in the calibrate.datalogger ()
function. The standard error obtained for each temperature after
calibration is pertinent as it includes corrections for accuracy and
resolution characteristics of the data logger but also accuracy and
resolution for the calibration thermometer and also temporal
drift when before and after calibration temperatures are used.

The correct calibration and adequate uncertainty of data
loggers according to the analyzed temperature-dependent
phenomenon seem quite logical but they are not always correctly
done or at least reported not in publications. When data loggers
are used to record temperatures to be analyzed in the context
of temperature change due to climate-change, it appears crucial
that temperatures are recorded with known uncertainty that is
at least smaller than the supposed effect of temperature.
For publication purpose, the function uncertainty. datalogger
() can be used to evaluate the uncertainty of one measurement
taking into account both accuracy and resolution effect. It can be
used also to evaluate the uncertainty of series of measurements
done during H hours at a h sampling rate.
For more articles in Open Access Journal of Engineering
Technology please click on:
For more Open Access Journals please click on:


Comments
Post a Comment