The Effect of Bio-Fuel Induced Bsfc Curve Perturbations on Realizable ICE Efficiency Using Cycling - Juniper Publishers
Juniper Publishers - Open Access Journal of Engineering Technology
Abstract
This paper provides an uncertainty analysis for
efficiency gains in internal combustion engines generated by cycling
between two operating points. The uncertainties are due to incomplete
knowledge of the bsfc field of the engine. In the case of bio fuels,
these uncertainties can be fairly large and exact bsfc curves are rarely
available. The proposed concept provides a graphical method for
determining whether cycling provides efficiency advantages despite the
presence of uncertainties. If cycling is beneficial for efficiency, the
introduced concept provides the power range those results in efficiency
advantages. The proposed method is based on a graphical evaluation in
the engine bsfc field, with uncertainties being represented by a bsfc
envelope. The decision making criterion is based on the bsfc envelope
and its relationship to the cycling induced bsfc curve.
Keywords: BSFC; Efficiency; Bio-fuel; Cycling; ICEHighlights
a. An envelope based model for bsfc uncertainties was introduced.
b. A method for determining if cycling provides
efficiency benefits under bsfc uncertainties was introduced and
graphically illustrated.
c. The effects of bsfc uncertainties on the power band for achievable bsfc gains was analyzed
Nomenclature
Bsfc [g/kW⋅h]Brake Specific Fuel Consumption
ICE [u]Internal combustion engine
CNG [u]Compressed natural gas
α1 [0-1] Duty cycle coefficient for power P1
α2 [0-1] Duty cycle coefficient for power P2
Δbsfc(p) [g/kW⋅h] The difference between bsfc for Diesel and Bio-Diesel as function of brake power
P [ kW] Engine brake power
P1 [kW] Power of low power operating point for Diesel
optP [kW] Brake power for which the bsfc minimum is reached for Diesel
avgP [kW] Average power
bsfcp [g/kW ⋅h] Mapping from P
bsfcp [g/kW ⋅h] Upper bsfc envelope boundary
bsfcp [g/kW ⋅h] Lower bsfc envelope boundary
ibsfcp [g/kW ⋅h] Induced bsfc using cycling between
bsfcP, ()optbsfcP.
Pmin [kW]Minimum power of power band for cycling
Pmax [kW]Maximum power of power band for cycling
S [%]The minimal percentage savings
Introduction
The choice of engine operating points is of great
importance for the design of fuel efficient hybrid drive systems [1-9].
Since in hybrid drives, generated power can be chosen more and less
independent of load power, the choice of operating points of the
engine is much less restricted. In essence, operating points that
correspond to low efficiency or high brake specific fuel consumption
need to be avoided and operating points at or near the lowest
bsfc region should be utilized.
In order to make a compelling case for the use of hybrid power
train technology in large heavy duty vehicles, one needs to show
the efficiency advantages over conventional drive systems. While
this has been done for a number of scenarios in previous work
[1,10], the assumption in previous work was always the exact
knowledge of the bsfc field. There are however a variety of influences,
environmental or otherwise, that can change the bsfc field
significantly. Some of these factors are engine and air temperature,
atmospheric pressure and altitude, humidity as well as fuel additives
such as Bio-Diesel and other types of air or fuel mixtures.
Very often, the bsfc field is not completely known and only a few
points in the entire bsfc diagram have a known bsfc value. Therefore,
this paper introduces an uncertainty analysis on bsfc curves
of ICEs with the goal of determining the benefits of cycling under
bsfc field perturbations. The term “cycling” denotes engine operation
at a few (here: two) operating points only. It has been shown
previously [1], that especially selecting operating points can generate
significant efficiency advantages for some engines [2-9]. This
is especially true if the engine was designed for cycling, but conventional
engines can also show efficiency gains from cycling [10].
The highest efficiency gains obtainable from cycling between two
operating points are most often generated if one operating point is
the global bsfc minimum and the other is close to zero power [1].
Previous work has addressed the problem of achievable efficiency
gains through cycling for bio-fuels [11], albeit under the assumption
of exactly known bsfc dependencies for both, regular Diesel
and Bio-Diesel. Conditions under which the efficiency advantages
of cycling for regular Diesel carry over to the case of Bio-Diesel
were formulated.
This article examines how despite the presence of bsfc uncertainties
one may still be able to decide whether engine cycling
provides overall efficiency benefits. The results are especially applicable
to bsfc uncertainties introduced through a variety of fuel
mixtures such as Diesel and Bio-Diesel, Diesel and hydrogen, Diesel
and CNG, and other environmentally preferable fuel additives
that affect the bsfc field of an engine.
Previous Work and Objective
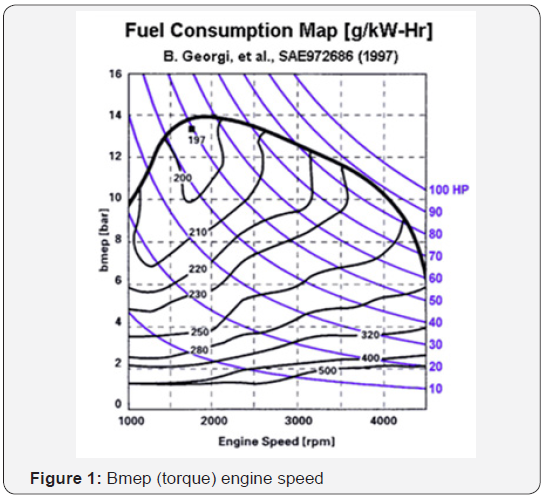
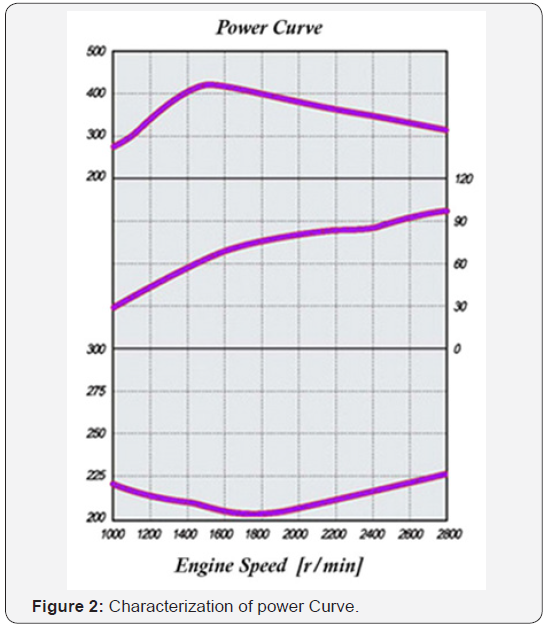
The bsfc data for engines is often provided in the torque versus
engine speed or power versus engine speed diagram (Figure
1). Alternatively separate characterization of bsfc and power or
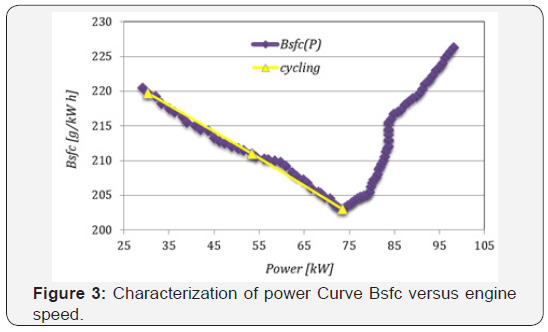
torque under full load are also often used (Figure 2). It is obvious
that given a power P, there are, except for some degenerate cases,
infinitely many different bsfc values associated with this power
level P. Therefore we define the function bsfc( p) as a mapping
from P to the lowest possible bsfc at power P, essentially converting
the usual relation bsfc( p) to the function bsfc( p) (Figure 3).
The here introduced concept builds on the work in Bauer PH
et al. [11] where for the first time, an analysis was carried out that
showed the conditions under which operating point switching
provides efficiency advantages in Bio-Diesel fuelled engines, given
the complete knowledge of the bsfc field for regular Diesel and
Bio-Diesel In a method to gauge fuel efficiency of cycled ICEs with
two operating points was introduced [1]. The results in Bauer PH
et al. & Ehsani M et al. [11,12] show how one can use bsfc results
on cycling for regular Diesel fuel and extrapolate to Bio-Diesel. The
results were based on the difference between the regular Diesel
bsfc curve and the relationship to Bio-Diesel in conjunction with
a number of simplifying assumptions. In particular it was shown,
that if the difference between the regular Diesel and Bio-Diesel
bsfc curves is approximately constant, and then the efficiency benefits
of cycling carry over from regular Diesel to Bio-Diesel. Another
case for which the benefits of cycling carry over to Bio-Diesel
are bsfc curves where the difference between the two respective
bsfc curves is maximal at the end points, i.e. the two operating
points. The exact condition was given as:

Where,
P1 ≤ P ≤ Popt α1 +α2
The objective of this paper is to present a method for determining
efficiency gains based on ICE cycling between two operating
point, if the bsfc curve is not exactly known. More specifically,
we assume the bsfc curve uncertainty is due to a bio-fuel mixture
for which exact bsfc data is often not available.
Methods
The approach taken for analysing the benefits of cycling under
bsfc uncertainties are based on the concept of “cycling induced
bsfc”, a concept that was introduced by the authors in Campanaro
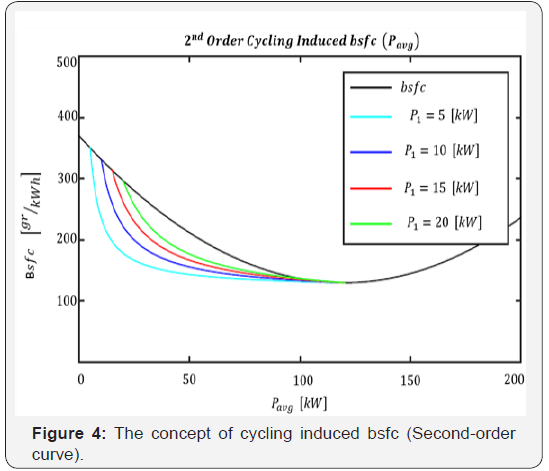
J et al. [1]. The relationship between the bsfc curve and the cycling
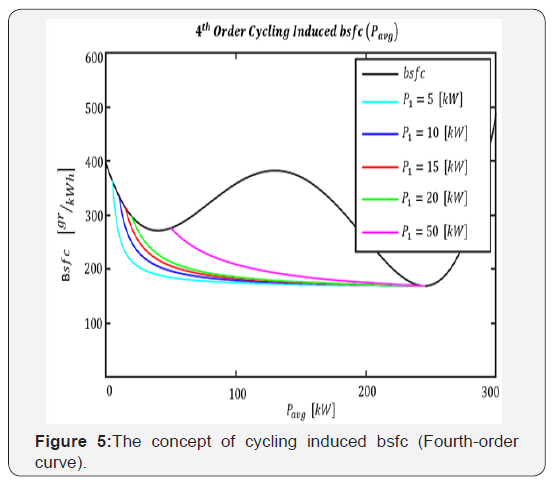
induced bsfc curve are shown in Figure 4. The figure shows
cycling bsfc for two different bsfc curves represented by a second
and forth order polynomial respectively. If the cycling induced bsfc
curve is below the regular nominal bsfc curve, cycling creates an
efficiency advantage. The cycling induced bsfc can be expressed
as follows:

Using knowledge of the nominal bsfc curve, sparse measurement
data or extrapolations, we construct bsfc intervals for every
power level thus creating an envelope around the nominal curve.
This envelope then contains the real bsfc curve and the upper and
lower envelope boundary can be taken as the worst and best case
bsfc respectively. The relationship between cycling induced bsfc
and regular nominal bsfc under bsfc uncertainties for bio-fuel
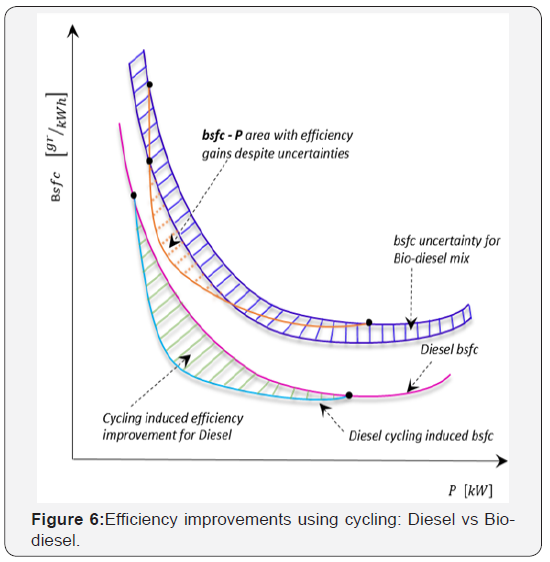
mixtures and exactly known bsfc for Diesel is shown in Figure 5.
The two lower curves show the bsfc for regular Diesel and the cycling
induced bsfc for this case. It is easily seen that the cycling induced
bsfc curve falls below the Diesel bsfc curve for a wide power
range. In other words cycling is beneficial over a wide power
range. The upper three curves in Figure 4 represent the upper and
lower envelop boundary for the uncertain Bio-Diesel bsfc and the
corresponding worst case cycling induced bsfc. The power range
for which the cycling induced bsfc is below the envelope of the
Bio-Diesel bsfc is comparatively small and the gains in that range
are also rather limited. Therefore this mechanism provides a fairly
simple graphical method to check whether the cycling induced
bsfc is below the conventional bsfc curve and provides the power
range for which cycling under uncertainties or perturbations remains
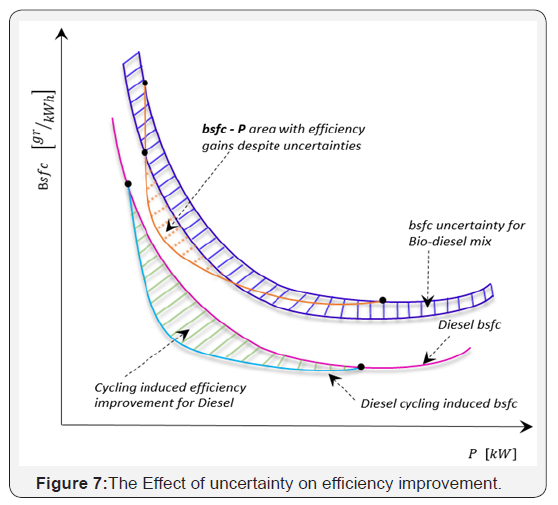
advantageous. Figure 6 shows the case of bsfc curves created
from two different levels of bsfc uncertainties. It is apparent
that an increase in bsfc uncertainty reduces the size of the power
interval for which cycling produces efficiency advantage. Similar
approaches can be taken to handle the case of uncertainties created
by environmental effects such as engine temperature, air pressure
and humidity, etc.
Analytically the graphical method can be expressed as follows:
Cycling under bsfc uncertainties is beneficial if for power P we
have:

The boundaries of the power interval for which cycling is advantageous
is given by the two solutions of the equation:

If this equation has no solution then cycling under uncertainties
does not provide efficiency advantages for any power level.
While this is not shown in Figures 4 & 5, theoretically there can be
more than two solutions to the above equation. However in reality
this case almost never occurs for highly loaded conditions. So from
here on we assume there are only two solutions to this equation,
which we denote as Pmin and Pmax , with min max Pmin ≠ Pmax . Let us now consider
the case where power is produced within this interval, i.e.
Pavg ∈ [Pmin,Pmax] .
Then the minimal percentage savings S relative to the conventional
case of operating the engine at power level avg P is given by:

In a similar way one can construct an expression for the maximum
percentage savings. In this case the lower bsfc envelope
needs to be considered for the construction of ibsfc via power levels
P1 and Popt and the maximum envelope needs to be utilized for
avg P .
Conclusion
This paper introduced a graphical method to determine
whether engine cycling results in efficiency benefits for a variety
of bio-fuels under a multitude of different operating conditions.
The method is based on the concept of cycling induced bsfc and
provides the interval of power levels that lead to improved efficiency.
The proposed concept can effectively deal with uncertainties
induced by different fuel mixtures as well as environmental
conditions such as engine temperature, ambient air pressure, humidity,
etc. Coarsely sampled bsfc fields with large uncertainties
can also be analysed using the proposed approach. The results are
an improvement over existing methods which typically assume
exact knowledge of the bsfc relationships for both, regular Diesel
and Bio-Diesel.
Future work concentrates on improving the conservativeness
of the results. It can be seen from Figure 7, that our method essentially
is a worst case analysis, since we assume the highest possible
bsfc at the two operating (end) points and the lowest bsfc in
between these two operating point. For very large uncertainties
in the bsfc values, the introduced method provides only very small
power ranges for which cycling generates efficiency advantages.
In extreme cases, it may not provide any solution. Therefore
one may improve over the results provided in this article by an
approach that uses families of bsfc curves in parameterized form
that makes use of the fact that the bsfc curves are smooth curves
without discontinuities.
Acknowledgement
This work was supported by NSF grant No 1239224. We gratefully
acknowledge the financial support of NSF.
For more articles in Open Access Journal of
Engineering Technology please click on:


Comments
Post a Comment