Analyzing Distances Based on Pixels using MATLAB: An Image Analysis Study - Juniper Publishers
Juniper Publishers - Open Access Journal of Engineering Technology
Abstract
The present research paper is addressed to the
distance between major US airports using image analysis to give the user
an accurate distance and estimated flight time for all major US
airports. The system inputs needed are an average distance between the
different US airports as well as the average flight speed. This research
is to utilize pixels from an image to create a coordinate system, which
allows us to calculate distances. Conversion factors will also be
included in our system inputs. The user inputs for our program will be
your starting location and the destination you are looking to travel to.
The governing equations for our code are the system input coordinates
on our image mapping and converting the distance between the coordinates
to an actual distance in miles. These coordinates and the use of the
equation of a line to get an accurate distance between airports in
miles. Multiplying the total distance by the average plane speed, while
accounting for taxi times, we got an accurate representation of the time
it will take to get between airports. The user-defined functions are a
multi-choice dialog box that the user is required to click on the
location that they are starting at which leads to another multi choice
dialog box requiring the user to input the destination they are looking
to go to. The entire bases of our research were based on menu and switch
cases.
Keywords: Pixels; US airports; Flight information; Matlab; Distance; Image analysisIntroduction
The distance between major US airports using image
analysis to give the user an accurate distance and estimated flight time
for all major US airports. The system inputs needed are an average
distance between the different US airports as well as the average flight
speed [1]. Conversion factors will also be included in system inputs.
The user inputs for our program will be your starting location and the
destination you are looking to travel to. The governing equations code
are the system input coordinates on image mapping and converting the
distance between the coordinates to an actual distance in miles. These
coordinates and use of the equation of a line to get an accurate
distance between airports in miles. Multiplying the total distance by
the average plane speed, while accounting for taxi times, one can get an
accurate representation of the time it will take to get between
airports.
The user-defined functions are a multi-choice dialog
box that the user is required to click on the location that they are
starting at which leads to another multi choice dialog box requiring the
user to input the destination they are looking to go to. The entire
bases of this research article will be based on menu and switch cases.
For example, if the user selects LAX, system use a switch case for the
different combinations of airports then display the information desired
by the user. To validate our program, the program can select the airport
in which we want to go to. It
should tell us the distance and approximate time it will take to reach
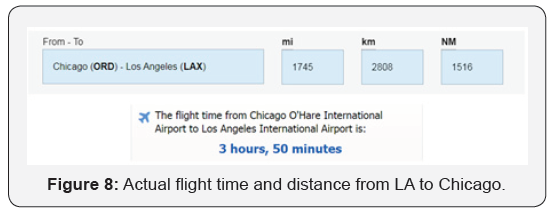
the destination. We can verify our results by using online flight
information including the actual distance and time and compare them to
our code.
Methods and Overview Software structure GUI structures
The structure which was used for the code was
sectioned based, so we could define which part of the code does what in a
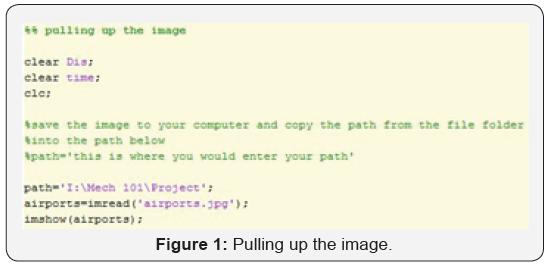
clear way. The first section of the code pulls up the image that was
used to define where the airports, we analyzed, are on a map of the
United States [2]. The commands “clear dis, clear time, and clc” were
used to clear any previous distance and time calculations in the
workspace and command windows to avoid confusion. After the command
codes were run we told MATLAB where our image is located within the
computer by creating a
path using the image file address. It was necessary to use the
command imread to allow MATLAB to read the image from a
graphics file (Figure 1).
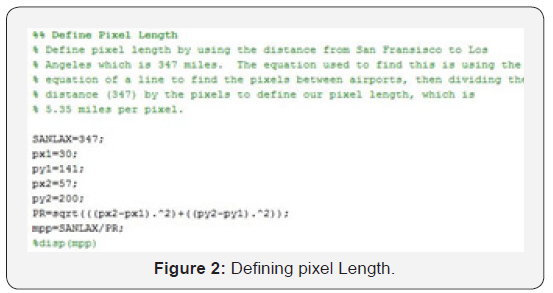
By finding the actual distance between the San Francisco
(SAN) and Los Angeles (LAX) Airports (approximately 347 miles)
we were able to define the length, in miles, that each pixel in the
image represented. By finding the centroids of both SAN and LAX
represented by circles on the image and then manually inputting
those coordinates into our script. Applying those coordinates
in the equation of a line we were able to find the pixel length
between SAN and LAX. The equation of a line is in Appendix
B. We discovered how many miles each pixel represented by
utilizing how many pixels were present between SAN and LAX,
dividing out the actual distance in miles by the pixel distance to
give us our miles per pixel(map) (Figure 2).
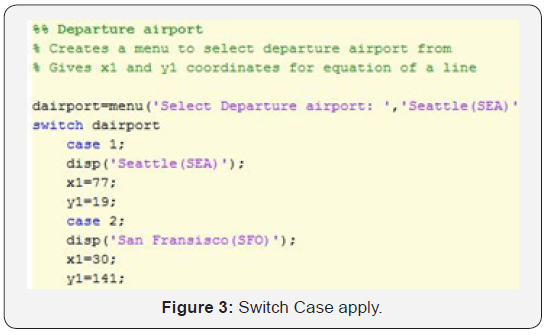
To adjust our code to a user-friendly platform, the centroids
of the top twenty US airports where represented as x and y
coordinates which we hard-coded into a switch case menu. Then
creating a second similar menu, so the user could select both a
departure and arrival airport from separate menus while giving
us two different x and y coordinates for each airport.
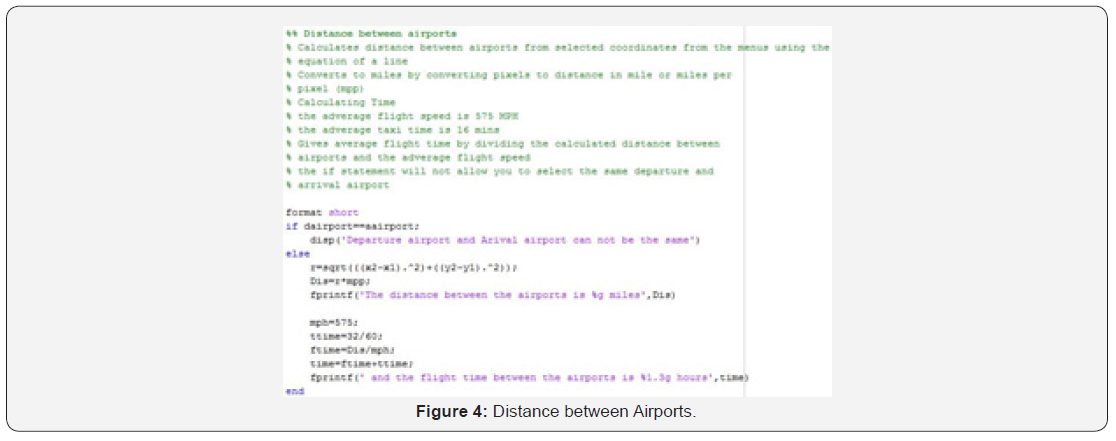
In Figure 3 we employed the selected airport’s coordinates
into an if else statement which allowed us to create a case where
the code would not work if the user selected the same departure
and arrival airport. If the chosen airports where different, the
coordinates are then placed into the equation of a line to find
the distance in pixels between those two airports. To convert
the distance from pixels to miles we multiplied our pixels by the
miles per pixel(mpp) we found earlier in our code. The average
flight time was found by dividing that distance in miles by the
average flight speed (approximately 575 mph) and adding the
average taxi times (approximately 32 minutes) to that found
number.
Displaying our results in Figure 4 to the user by using fprintf
statements to print the results into the command window. Finally,
to display on the map where the user would be traveling to and
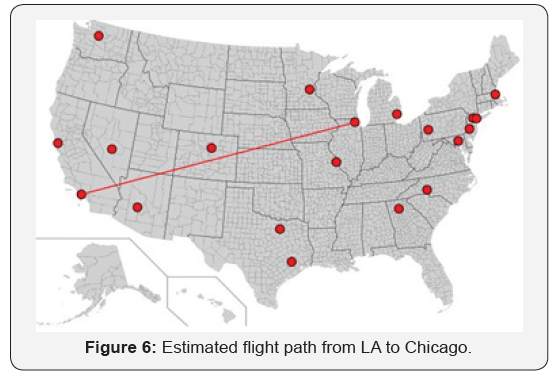
from, we used the command “line” to draw a line on our image
between the two selected airports. The result of this code is a
statement clearly defining what the estimated distance and flight
time between two airports that the user selects from the menus
as well as a line on the map to display a visual representation of
the estimated flight path (Figure 5).

Result and Discussion
To create a coordinate system, which allows us to calculate
distances. We did this by using an equation of a line and a picture,
which gave us the ability to convert the number of miles in one pixel. This kind of program was created to provide a simple
interface for a US traveller to quickly find the distance and time
for an airline flight from their departure and arrival airports. We
were able to achieve this by using multiple Matlab tools, such as
imread, show, switch cases, if else statements, etc (Figures 6-8).

There are multiple ways that we can make the program
better and more efficient. One way is to utilize better equations,
for example, we used an average flight speed; instead of this,
we could introduce a fluctuating speed through differential
equations. A better way to calculate the flight path would be by
using flight path equations with drag. Another way we could
make the program more accurate is to use a higher quality image.
If the image were of higher quality, then the coordinate accuracy
would be much more precise. One thing that could be taken into
consideration is more variables such as wind speed, drag, and
taxi times. If these variables are introduced, then the times and
distances can be calculated much more precisely. If all these
improvements get put into the project, then our program would
run much more efficiently and accurately.
Acknowledgment
Authors thank Dr. Jenna E Pink for giving ideas of using
pixels as a unit for measuring distances. Authors also thank
the Department of Mechanical Engineering, the University of
Wisconsin-Milwaukee for proving necessary facilities to work in
this area as a part of the undergraduate project.
For more articles in Open Access Journal of
Engineering Technology please click on:


Comments
Post a Comment